RESEARCH ARTICLE
Dynamic Detection of Thicknesses in Polymer Deformation Based on the Optical Coherence Interferometry Technique
Eneas N Morel*, Jorge R Torga
Article Information
Identifiers and Pagination:
Year: 2015Volume: 2
First Page: 11
Last Page: 16
Publisher Id: PHY-2-11
DOI: 10.2174/1874843001502010011
Article History:
Received Date: 3/12/2014Revision Received Date: 17/2/2015
Acceptance Date: 8/6/2015
Electronic publication date: 31/7/2015
Collection year: 2015
open-access license: This is an open access article licensed under the terms of the Creative Commons Attribution Non-Commercial License (http://creativecommons.org/licenses/by-nc/3.0/) which permits unrestricted, non-commercial use, distribution and reproduction in any medium, provided the work is properly cited.
Abstract
We describe the implementation of the optical coherence interferometry (OCT) technique in the dynamic measurement of the deformation of polymers. The experimental set-up of the interferometer system and the signal processing used are also described. Theories and methods for measuring polymer film thickness are presented and the results are shown. In this work, the technique does not account for the determination of the refractive index.The study found that the dynamic estimation of the thickness of thin polymer films is possible and very accurate.
1. INTRODUCTION
The measurement of distances with non-invasive techniques is a developing theme, and a variety of techniques are used for this purpose. Among them, optical techniques have evolved fast with the emergence of new sources of light and detection systems: for example, triangulation [1] and interferometric techniques [2].
In this paper, we focus on the interferometric low-coherence [3] or broadband [4] technique, in which the light sources used are not monochrome [5]. It presents interesting aspects that make it different from the traditional interferometric techniques.
The main advantage in terms of distance measurements is the ability to measure without the phase ambiguity. This technique was first applied in the area of communications [6], medicine and biology [7] and studies of surfaces [8].
The OCT technique has been used with excellent results in medicine where studies were conducted on the thickness of corneas [9], the cardiovascular system [10], and cartilage [11].
In this paper, we investigate the application of this technique for dynamic detection of deformation in polymers used in arterial prostheses with variations of 1 mm and a resolution better than 1 μm and at the same time obtain the change in thickness.
The motivation for this work is to develop a system that will allow precise measurement of dynamic profiles and the thickness of arteries in prostheses. Fast Fourier transform (FFT) in the analysis of the image signal interference is applied to show how this can improve resolution, dynamic range and noise reduction.
2. METHOD
The main idea is to use the interference signals produced by reflections from the different sides of the sample and the reference mirror.
The phase of interference signal obtained by the Fourier transform, which determines variations in the thickness and the variation of the position of each face of the sample to be deformed.
The experimental set-up used for the interferometer is the Michelson type shown in Fig. (1).
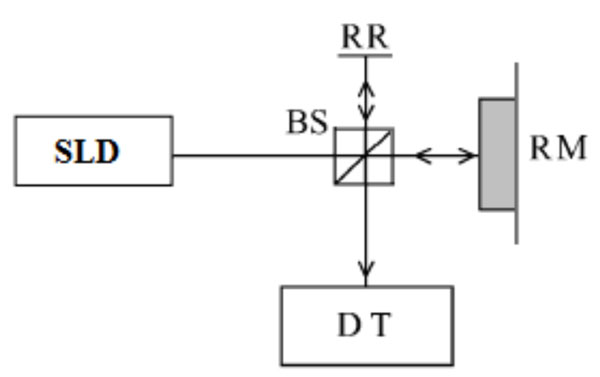 |
Fig. (1). Experimental set-up: SLD is the light source; RR the reference mirror; RM the sample; BS the beam splitter; and DT is the detector system. |
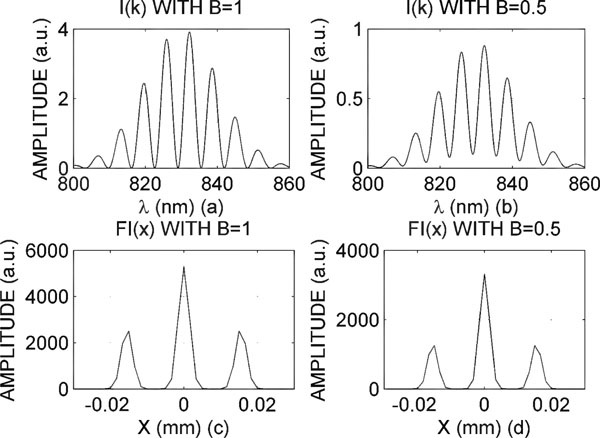 |
Fig. (2). Intensity and its corresponding fourier transform for two different values of b (a.u.= arbitrary units). |
 |
Fig. (3). In graph (a) calibration signal; in graph (b) interpolate signal. |
 |
Fig. (4). Sample in stationary state. |
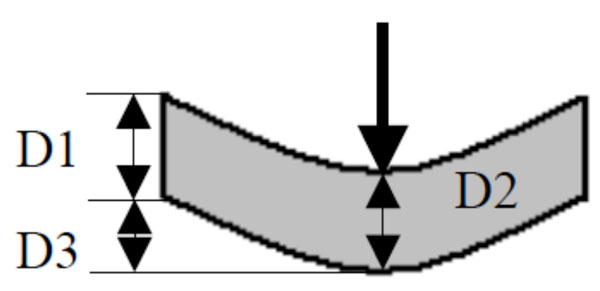 |
Fig. (5). Sample with false deformation. |
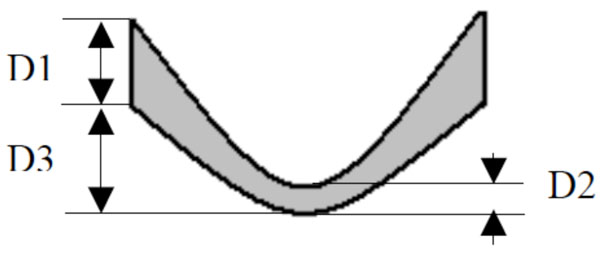 |
Fig. (6). Sample with deformation. |
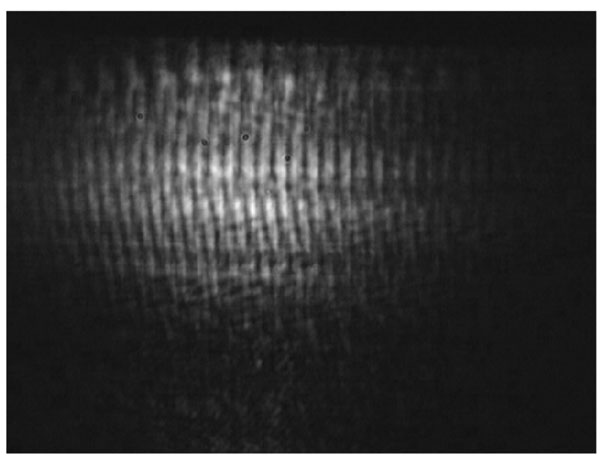 |
Fig. (7). Captured image. |
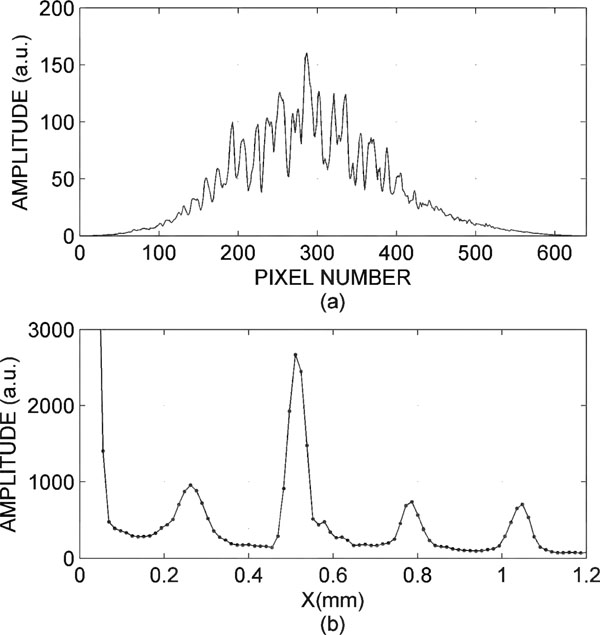 |
Fig. (8). In graph (a) the measurement signal; in graph (b) the Fourier transform. |
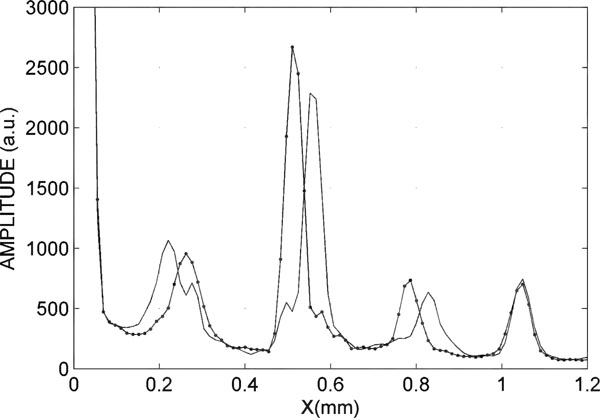 |
Fig. (9). Interference peak for the sample in equilibrium (line) and deformed (line and point). |
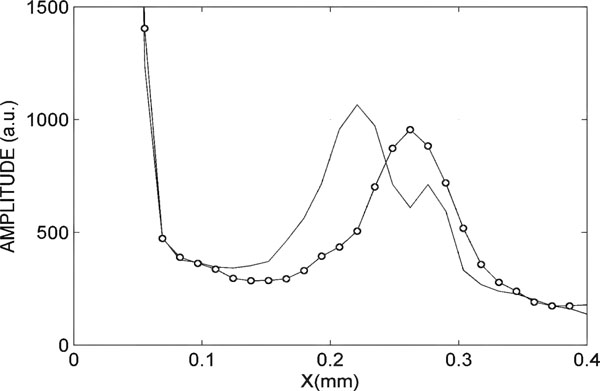 |
Fig. (10). Zoom of the interference peak that represents the thickness of the sample. |
In one arm of the interferometer the sample to be measured is placed (RM in Fig. 1), and on the other arm (RR in Fig. 1) a reference surface is positioned, in this case a mirror (New Focus 5103).
Light reflected in each arm generates an interference signal, which in the phase encodes optical path difference (OPD) between the two arms.
The interference signal is input to the detection system (TD). This system is a spectrometer with a diffraction grid with 1200 lines per millimetre and a CCD sensor with 640 x 480 pixels, which form the image of interference with a sample rate of 1 ms.
The description of the function of light intensity dependent on the OPD is determined by Eq. (1) [12]:

where Ir is the reference arm intensity, Is is the sample arm intensity and δ is the encoded face. For a system in vacuum δ = k∆x, where k is the wavenumber and ∆x is the OPD; this OPD is measured from the beam splitter to each arm [13].
We consider now a non-monochromatic source with a Gaussian spectrum:

where k is the wave vector and Δk is the spectral width of the source.
Experimental and simulated results shown in this paper correspond to a superluminescent diode with a central wavelength λo= 800 nm and a spectral width ∆λ= 20 nm.

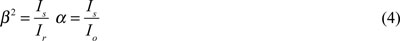
where β is the visibility or modulation depth and a is the reference reflectivity defined as:
2.1. Analysis
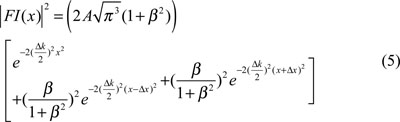
We define FI(x) as the Fourier transform of I(k) with x the conjugate variable.
In Fig. (2) intensity I(k) is shown for two different values of β (graphics (a) and (b)).
The square module of FI(k) is shown in graphics (c) and (d).
The two lateral Gaussian peaks correspond to the second and third term of Eq. (5) and their centres are the ± value.
To measure absolute distances it is necessary to carry out a calibration of the system. To do this the sample is replaced by a mirror.
The calibration process consists of a controlled movement of the reference mirror in order to introduce a variable path difference (). For each position of the mirror, we measured the centre position of the interference peak and simultaneously the absolute displacement with a position sensor (Universal Motion Controller Newport ESP-300 - translation stage). With this calibration it is possible to obtain independence of the relative position of the arms of the interferometer.
A typical calibration curve is represented in Fig. (3). The corresponding relation is:

where Äx is the distance in mm and F is the corresponding centre position of the interference peak (in pixel units).
3. RESULTS AND DISCUSSION
The experimental set-up is similar to that shown in Fig. (1), except for the sample arm, where the sample is placed in a ring allowing it can apply a normal force to produce the desired deformation.
The light source is a superluminescent diode (Hamamatsu L8414-04 -SLD with power light: 3mw @ 800 nm). In the reference arm is an attenuator system to control the visibility (β).
The deformation is produced by acoustic action through a speaker. This achieves control over the frequency of movement obtained with an Agilent 33220A signal generator.
When the sample is in stationary state, it is not suffering from any deformation, as shown in Fig. (4).
When normal force is applied, the sample is deformed, as in Fig. (4).
The first supposition is that D1 and D2 are equal. This supposition is not true, because the thickness changes when a force is applied, as in Fig. (6).
Where D1 and D2 are no longer equal, D3 being the same distance in Fig. (5) and Fig. (6).
The proposal is to measure the deformation produced on each interface of the sample and the change in thickness in a single measurement.
Fig. (7) shows the image obtained with the OCT technique (optical coherence interferometry), when the sample is in stationary state.
Through analysis of the image, one can obtain the thickness of the sample and distances on the faces of the sample in the mirror reference, as shown in Fig. (8a).
Noting in Fig. (8b), you can discriminate four Gaussian peaks and one centred on the zero (not taken into account in the analysis). The first peak is produced by the reflections on both sides of the sample and it is the sample thickness. The second peak is the relative distance of the first side of the sample with respect to the reference. The third peak is the relative distance from the second side of the sample and reference. The last peak is caused by a camera filter.
In previous work [14], we tested the method's accuracy, which was less than 1 µm.
The strain produced by the acoustic wave requires the sample to be moved from its equilibrium position and changes its thickness.
Dynamic measurement is performed by capturing images with a sampling time of 1 ms.
As the thickness varies, the measured interference signals allow us to obtain the distance of deformation D3 and D2, indicating how the sample was deformed.
In Fig. (9), the curve with a point shows the distances of the sample represented in equilibrium state (without application of deformation), and the curve with an asterisk shows the distances when the signal of deformation is applied.
The displacement value is 0.0552 mm and the change of thickness is 0.0069 mm, with a system error less than 0.5 microns.
In Fig. (10), one can observe in detail the interference peak that indicates the change of thickness in the sample. The continuous curve is the interference peak in steady state and the curve point is the interfering peak when the sample has a maximum strain.
It should be noted that the change of thickness is small compared with the deformation of the sample. Dynamic measurement of thickness is interesting because it allows to determine the elastic behaviour of the material under study.
CONCLUSION
We have shown that the technique of interferometry broadband allows the study of dynamics in semi-transparent materials, constant forces being applied or varying time. It has been observed that effects of variations in time force the deformation of each side of the sample. The maximum sampling rate is limited by the response of the detector. Semi-transparent material additionally permits small changes in the thickness of the sample.
Real-time measurement of thickness change is of great interest, because it allows us to study the drying of paints and varnishes and solvent evaporation.
We can see that each interface of the sample has a different deformation. This implies that the interface on which the force is applied suffers greater deformation.
The accuracy of this system is 0.50 μm. The dynamic range of the system, in our case 10 µm to 2 mm, can be adjusted according to the application.
CONFLICT OF INTEREST
The authors confirm that this article content has no conflict of interest.
ACKNOWLEDGEMENTS
Declared None.