RESEARCH ARTICLE
Study of Optical Constants of ZnO Dispersed PC/PMMA Blend Nanocomposites
Shalini Agarwal1, Y. K. Saraswat2, Vibhav K. Saraswat1, *
Article Information
Identifiers and Pagination:
Year: 2016Volume: 3
First Page: 63
Last Page: 72
Publisher Id: PHY-3-63
DOI: 10.2174/1874843001603010063
Article History:
Received Date: 4/5/2015Revision Received Date: 28/9/2015
Acceptance Date: 26/10/2015
Electronic publication date: 26/08/2016
Collection year: 2016
open-access license: This is an open access article licensed under the terms of the Creative Commons Attribution-Non-Commercial 4.0 International Public License (CC BY-NC 4.0) (https://creativecommons.org/licenses/by-nc/4.0/legalcode), which permits unrestricted, non-commercial use, distribution and reproduction in any medium, provided the work is properly cited.
Abstract
Present research work deals with the optical study of Zinc Oxide (ZnO) dispersed Polycarbonate/Polymethylmethacrylate (PC/PMMA) blend nanocomposites. ZnO nanoparticles have been prepared by simple chemical route and their average size has been confirmed by Transmission Electron Microscopy (TEM). The average particle size of the nanoparticles has been found to be ~11 nm. Formation of PC/PMMA blend nanocomposites has been confirmed by means of X-ray Diffraction (XRD). Absorption spectra, recorded using UV-Visible spectrophotometer, have been used to determine optical constants such as band gap, extinction coefficient, refractive index and real & imaginary part of dielectric constant. It has been found that band gap decreases as ZnO wt% increases in the blend nanocomposites. Lowest band gap has been found for PC25%/PMMA75% with ZnO 3 wt% blend nanocomposite. Increase in refractive index has also been found with increasing ZnO content. These types of blend nanocomposites have applications in UV-shielding and wave guide technologies.
1. INTRODUCTION
The dispersion of inorganic nanoparticles into the polymer matrix provides high-performance novel materials that find applications in many industrial fields due to their unique properties like high homogeneity, cost effective processability [1, 2]. Polymer blend nanocomposites are attractive route for producing new polymeric materials with tailored properties without having to synthesize totally new materials [3, 4]. The characteristics of these nanocomposite films can be manipulated by varying the polymer matrix, nanoparticles and their composition [5, 6]. Transparency is a key property of polycarbonate (PC). PMMA (Acrylic) is an important optically clear material widely used as sheet glazing materials, optical lenses and fluorescent solar collections. Zinc Oxide (ZnO) is a wide band gap semiconductor that shows high optical properties [7-10].
A plenty of work has been done on the optical properties of nanocomposites. M. F. H. Kadhemy et al. [11] have studied the effect of doping percentage of CuO2 to polystyrene films on the optical properties and concluded that CuO2 has modified the structure of the host polymer. Also the refractive index n and the extinction coefficient k have increased with increasing CuO2 content. I. A. Boginskaya et al. [12] have described an algorithm for calculation of the optical characteristics of polyparaxylylene–silver nanocomposite. Multilayer polymeric interference filters have been prepared using the resulting data. V. S. Sangawar et al. [13] have studied the optical properties of thin films of Polystyrene (PS) with different concentrations of ZnO nanoparticles. The study has also been extended to include the changes in the optical parameters including the band tail width and band gap energies for the samples.
Present work has concerned with the study of optical constants of ZnO dispersed PC/PMMA blend nanocomposites.
2. MATERIALS AND METHODS
All polymers and materials of research grade were used for sample preparation. The Polycarbonate (mw~64000) in granular form, Zincacetate Dihydrate and Thioglycerol, have been procured from Sigma Aldrich (USA). Grains of Polymethylmethacrylate (mw~15,000) were purchased from Himedia, Mumbai (India). Di-Methylenesulphoxide (DMSO), Potassium Hydroxide (KOH) and the solvent Di-Chloro Methane (DCM) were purchased from Merck Pvt Ltd Mumbai (India).
Zinc Oxide (ZnO) nanoparticles were synthesized by chemical route using zinc acetate and potassium hydroxide as precursors. In this method zincacetatedihydrate was mixed in Di-Methylenesulphoxide and stirred to completely dissolve the zinc acetate. Potassium hydroxide (KOH) solution in ethanol was also prepared in the same way. After dissolution of zincacetate, KOH solution and thioglycerol were added and solution was stirred, untill it turned milky. Solution was centrifuged and precipitated ZnO nanoparticles were washed with ethanol and then dried [14].
Polycarbonate (PC) and Polymethylmethacrylate (PMMA) were used as precursors for the synthesis of PC/PMMA-ZnO blend nanocomposites. For this, PC/PMMA in 100/0, 75/25, 25/75, 0/100 wt%/wt% composition, was dissolved in Dichloromethane (DCM) and stirred until a homogeneous solution was obtained. ZnO nanoparticles were dispersed in this solution with 1, 2 and 3 wt % and sonicated. The resulting solution was casted on to glass petridish and dried. Dried film was peeled off from petridish and used for further characterization.
3. RESULTS AND DISCUSSION
3.1. Transmission Electron Microscopy (TEM)
Fig. (1) shows the TEM image of as synthesized ZnO nanoparticles. It has been observed that particles are spherical in shape with small aggregations. The average particle size of ZnO nanoparticles come out as ~11 nm by TEM analysis.
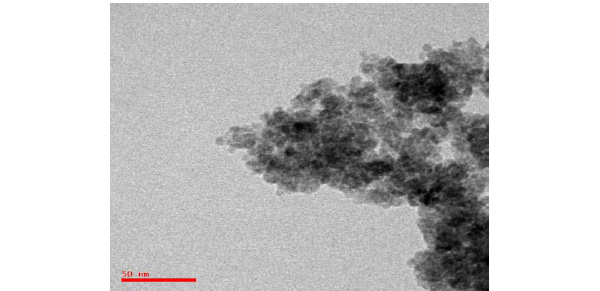 |
Fig. (1). TEM image of as prepared ZnO nanoparticles. |
3.2. X-Ray Diffraction (XRD)
Fig. (2) shows the XRD pattern of as synthesized ZnO nanoparticles.The diffraction peaks of ZnO nanoparticles appeared at 2θ values 31.49,34.18,35.47.25,56.30,62.57 and 67.81have been keenly indexed as hexagonal wurtzite phase of ZnO. XRD peaks indicates that the prepared material consist ofparticles in nanoscale range.The average particle size of as synthesized nanoparticles have been determined ~11nm using Debye Scherrer equation [15].
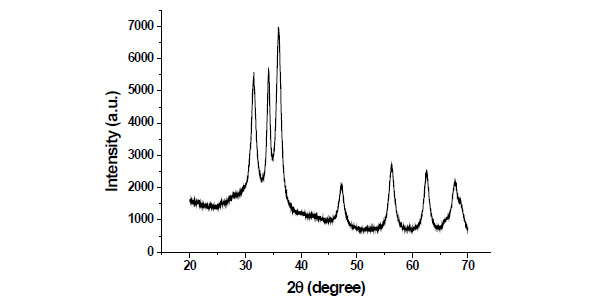 |
Fig. (2). XRD pattern of as synthesized ZnO nanoparticles. |
Fig. (3a-d) shows the X-ray Diffraction (XRD) patterns of prepared PC/PMMA-ZnO blend nanocomposites. In present study XRD patterns have been obtained using X-ray Diffractometer Bruker D8 Advance with Cu (Kα) radiation (λ=1.54 Å) in the range of 2θ from 20°-70°.
 |
Fig. (3). XRD patterns of ZnO filled (a) PC 100% (b) PC75%/PMMA25% (c) PC25%/PMMA75% (d) PMMA 100% nanocomposites. |
The XRD patterns Fig. (3) show a broad noncrystalline peak in 2θ range 25°-35° of PC/PMMA and nanocrystalline diffraction peaks in 2θ range 30°–70° of ZnO. This broadening is the signature of the polymeric nature of the samples and is also indicative of the fact that the material possesses short range order. Nanocrystalline diffraction peaks in all XRD patterns are corresponding to ZnO nanoparticles, which show that the size of ZnO particles in the PC/PS matrix remains in nano regime. Presence of sharp peaks confirms the preparation of blend nanocomposites.
3.3. UV-Vis Spectroscopy
The absorption spectra have been recorded using Perkin Elmer LAMBDA-750 UV-Vis spectrophotometer in the wavelength range of 250 nm -800 nm. The optical absorption coefficient (α), which is a function of wavelength, have been calculated from the optical absorbance spectra by using the relation [16].
 |
(1) |
Where, Iº and It are the intensities of the incident and transmitted beams, respectively. A is the optical absorbance, and t is the film thickness. Fig. (4a-d) shows the absorption spectra of prepared PC/PMMA-ZnO blend nanocomposites.
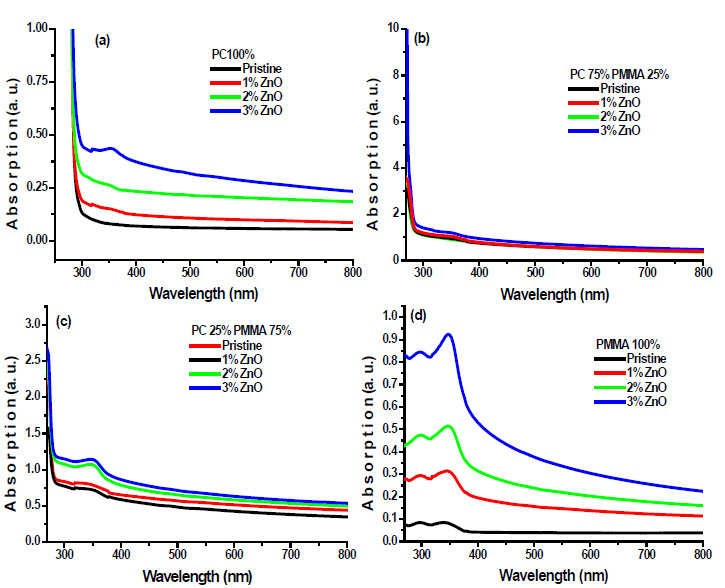 |
Fig. (4). Absorption spectra of ZnO filled (a) PC 100% (b) PC75%/PMMA25% (c) PC25%/PMMA75% (d) PMMA 100% nanocomposites. |
Absorption spectra demonstrate the onset of absorbance for these films in the range 250 nm-300 nm, which can be attributed to the excitation of electrons from the valence band to the conduction band of PC. It has also been observed in absorption spectra that it shows an additional band at 348 nm, which can be assigned to Zn-O chromophoric groups. The absorption intensity of this band increases with increasing ZnO wt% in blend samples. ZnO is a wide band gap semiconductor [17], and it has a high-absorption coefficient in the UV.
Thus, in contrast to the visible, the composite films are strongly absorbing in the UV region, so, the result could be attributed to high absorbance of ZnO. Furthermore, these results show the interaction between the polymer blend and the filler. In addition, there are no absorption bands in the visible region for all samples under investigation, since the films are transparent. The optical absorption of the blend nanocomposite films in the UV region is quite high and this aspect highlights the prospects of applications of these films in UV shielding.
Optical Absorption Spectra has been used to study optical constants such as, optical band gap, extinction coefficient, refractive index and real & imaginary part of dielectric constants of prepared blend nanocomposites.
3.4. Band Gap
The absorption edge for transitions can be obtained in view of the model proposed by Tauc [18, 19] as;
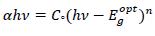 |
(2) |
Where, Cº is energy independent constant related to the properties of the valance and conduction bands, hν is the photon energy, α is the absorption coefficient, Egºpt is the optical energy band gap of the material. The value of parameter ‘n’ for allowed direct transition is ½ [19]. The variation of (αhν) 2 against (hν) yields a good straight line fit to the absorption edge and the extrapolated (hν) at which (αhν)2 = 0 provides the optical band gap Egopt. Fig. (5) shows the variation of (αhν)2 against (hν). The optical energy gap has been determined from the intercepts of extrapolations to zero with the photon energy axis (αhν)2 → 0 as shown in Fig. (5).
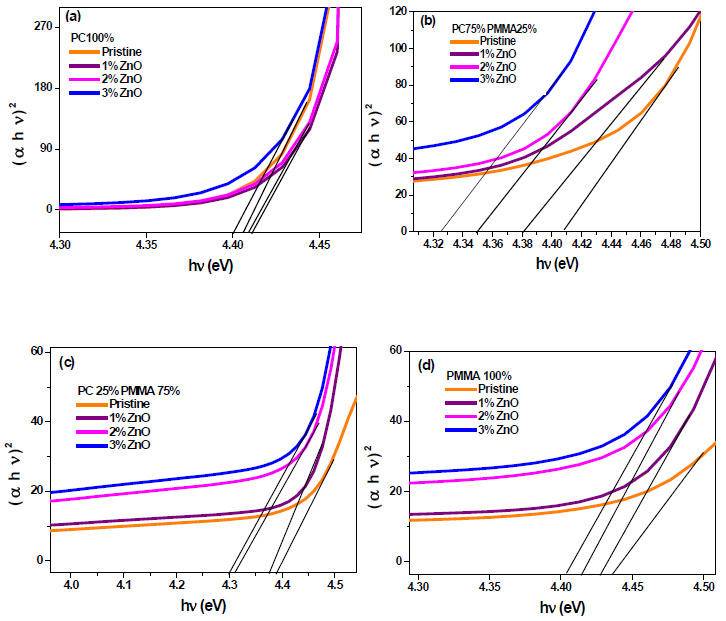 |
Fig. (5). Band gap determination for ZnO filled (a) PC 100% (b) PC75%/PMMA25% (c) PC25%/PMMA75% (d) PMMA 100% nanocomposites. |
From these figures, it has been seen that an increase of concentration of ZnO in the system leads to a decrease in the optical band gap. This is because the band gap of ZnO is lower than that of polymer matrix. Lowest band gap (4.3 eV) has been found for PC25%/PMMA75% with ZnO 3 wt% blend nanocomposite.
3.5. Extinction Coefficient
The extinction coefficient k is directly proportional to absorption coefficient (α), k can be obtained from the relation [20] as;
 |
(3) |
Where, λ is the wavelength of light. The extinction coefficient k has been calculated using equation (3). Fig. (6a-d) shows the variation of extinction coefficient against wavelength (λ). The decrease in the extinction coefficient with an increase in wavelength shows that the fraction of light lost due to scattering.
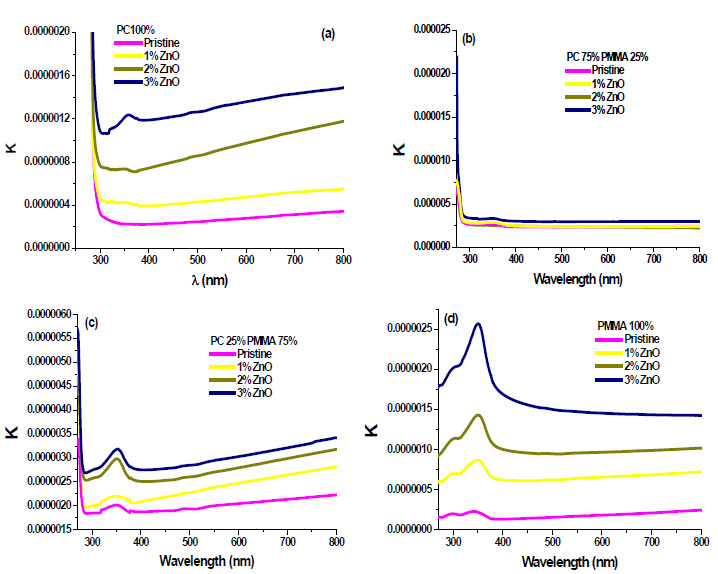 |
Fig. (6). Extinction coefficient for ZnO filled ( a) PC 100% (b) PC75%/PMMA25% (c) PC25%/PMMA75% (d) PMMA 100% nanocomposites. |
3.6. Refractive Index
The variation of the refractive index ‘n’ has been calculated by [21];
 |
(4) |
Where, R is reflectance. Refractive index ‘n’ determines how reflective and refractive a film made from this material will be [22]. Variation of refractive index with respect to wavelength of prepared PC/PMMA-ZnO blend nanocomposites has been shown in Fig. (7a-d). It has been observed that refractive index increases with the increase in ZnO content. Further, the maximum value of the refractive index has been found nearly 2.6 at around 450 nm. These high refractive indexed blend nanocomposites have applications in waveguide technology, antireflective coating and solar cells [23].
3.7. Dielectric Constant
The real (εr) and imaginary (εi) parts of the dielectric constant are related to the ‘n’ and ‘k’ values. The values of the real and imaginary dielectric constants have been given by the following equations [24, 25];
 |
(5) |
 |
(6) |
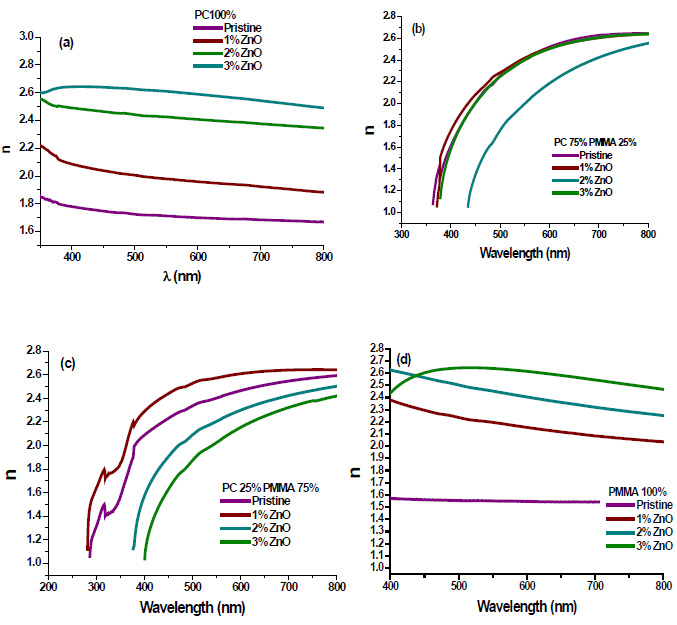 |
Fig. (7). Refractive index of ZnO filled (a) PC 100% (b) PC75%/PMMA25% (c) PC25%/PMMA75% (d) PMMA 100% nanocomposites. |
The real and imaginary parts of dielectric constant have been calculated using relation (5) and (6), respectively. These calculations give the information about loss factor. Figs. (8 and 9) show the variation of real and imaginary parts of dielectric constant of ZnO filled PC75%/PMMA25% and PC25%/PMMA75% as representative cases. It has been observed that variation of εr basically depends on n2 because the values of k2 are small as compared to values of n2while εi mainly depends on the values of extinction coefficient k. The real part of the dielectric constant has been associated with the term that shows how much it will slow down the speed of light in the material and the imaginary part shows how a dielectric absorbs energy from an electric field due to dipole motion [26].
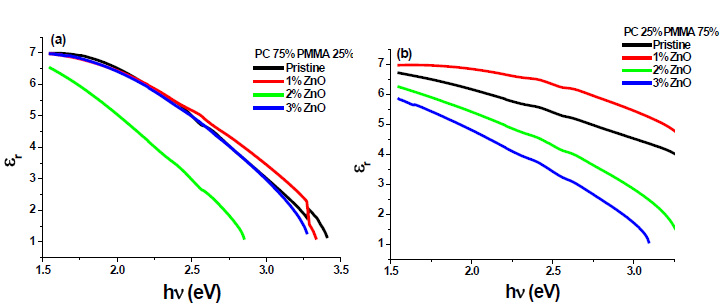 |
Fig. (8). Real part of dielectric constant of ZnO filled (a) PC75%/PMMA25% (b) PC25%/PMMA75% nanocomposites. |
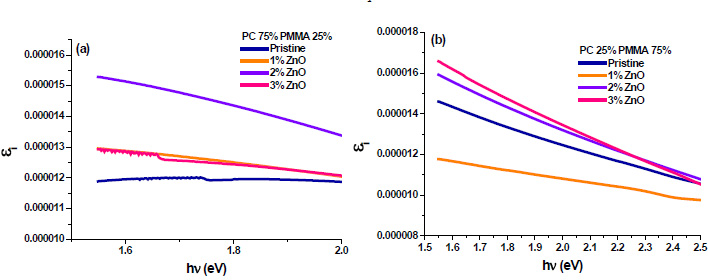 |
Fig. (9). Imaginary part of dielectric constant of ZnO filled (a) PC75%/PMMA25% (b) PC25%/PMMA75% nanocomposites. |
CONCLUSION
ZnO nanoparticles have been prepared by simple chemical route. The average particle size of the ZnO nanoparticles comes out to be ~11 nm using Transmission Electron Microscopy (TEM) and Debye Scherrer equation. A Series of ZnO (1, 2 & 3 wt%) filled PC/PMMA (100/0, 75/25, 25/75, 0/100 wt%/wt% composition) blend nanocomposites have been prepared successfully by solution casting method. X-ray Diffraction (XRD) patterns confirm the formation of PC/PMMA-ZnO blend nanocomposites. UV-Visible spectroscopy has been used to study optical constants of these blend nanocomposites. Absorption spectra shows an additional band at 348 nm, which can be assigned to Zn-O chromophoric groups. The absorption intensity of this band increases with increasing ZnO wt% in blend nanocomposites samples. The band gap decreases as ZnO wt% increases in the blend nanocomposites. Lowest band gap (4.3 eV) has been found for PC25%/PMMA75% with ZnO 3 wt% blend nanocomposite. The decrease in the extinction coefficient with an increase in wavelength has also been found. The refractive index increases with increasing ZnO content. Variation of εr basically depends on n2 due to the small values of k2 and εi mainly depends upon the values of extinction coefficient k. Furthermore, the obtained optical features of these blend nanocomposites films are suitable for the applications of UV shielding and wave guide technologies.
CONFLICT OF INTEREST
The authors confirm that this article content has no conflict of interest.
ACKNOWLEDGEMENTS
Authors are thankful to DST, Govt. of India for supporting Banasthali University under its CURIE scheme.