RESEARCH ARTICLE
Exotic Low Mass Unflavored Mesons: New Data Using Old Measurements
B. Tatischeff, E. Tomasi-Gustafsson*, #
Article Information
Identifiers and Pagination:
Year: 2014Volume: 1
Issue: Suppl 1: M10
First Page: 15
Last Page: 26
Publisher Id: PHY-1-15
DOI: 10.2174/1874843001401010015
Article History:
Received Date: 25/11/2013Revision Received Date: 24/01/2014
Acceptance Date: 25/01/2014
Electronic publication date: 31/12/2014
Collection year: 2014
open-access license: This is an open access article licensed under the terms of the Creative Commons Attribution Non-Commercial License (http://creativecommons.org/licenses/by-nc/3.0/) which permits unrestricted, non-commercial use, distribution and reproduction in any medium, provided the work is properly cited.
Abstract
Existing data exhibit signatures of small peaks, often not commented by the authors. These peaks are tentatively associated to narrow exotic low mass unflavored mesons. Increasing confidence for the existence of such mesons is obtained from various measurements performed for different aims. These data are discussed and their masses are compared with previously observed low mass mesonic structures. Attempts are presented to interpret the data and classify them according to a simple scheme.
1. INTRODUCTION
This paper summarizes the present knowledge of the low mass narrow mesonic structures observed in various data. The status of the present knowledge concerning unflavored mesons, is summarized in [1] (PDG). The narrow, low mass mesonic structures, discussed in the present paper, do not have room in the quark model. They are weakly excited, when compared to the PDG meson excitations. They are not present in the PDG tables. For all these reasons they are called exotics.
The determination of the nature of these resonances is a theoretical challenge. QCD allows the existence of glueballs or hybrids. However the common belief, based mainly on the lattice calculations, is that they should be found at higher masses than those studied in the present work, namely at M ≥1.5 GeV [2]. In the same way, it is generally assumed that the addition of a gluon to a quark pair induces mesons with masses ≥1.5 GeV. The observed narrow structures are not likely to be molecules, since the molecules are weakly bound states of two hadrons. Their masses should then be close to two pion mass (two meson masses). There is also the possibility for the existence of mesons with quantum numbers not allowed within the non relativistic quark model. The theoretical predictions for the existence of exotic (not mesons) are still under discussion, and are associated to the existence of several experimental candidates. The masses of these candidates are all located above the mass range studied in the present paper. Several papers review this problem [3]. At present, a very large number of papers, stimulated by the experimental results of e+ e! colliders study the exotic XYZ charmonium-like mesons [4]. The unflavored tetraquark description remains the most likely, although it is again usually associated to mesons heavier than 1 GeV.
2. PUBLISHED DATA NOT IDENTIFIED AS POSSIBLE SIGNATURES OF NARROW UNFLAVORED MESONS
Several published data have been reanalyzed and discussed with the aim to study the properties of excited unflavored mesons. These data are reconsidered here with the aim to highlight possible additional signals, which were not previously discussed, and which can give arguments in support to new physics, namely the existence of low mass narrow unflavored mesons.
This paper intends to look for these data, and to extract small signatures of such possible exotic mesons. In addition, a brief summary of papers having already stressed their existence, will be recalled. With exception of the present Fig.(1), which is reprinted, the other data are read and reproduced in the plotted figures.
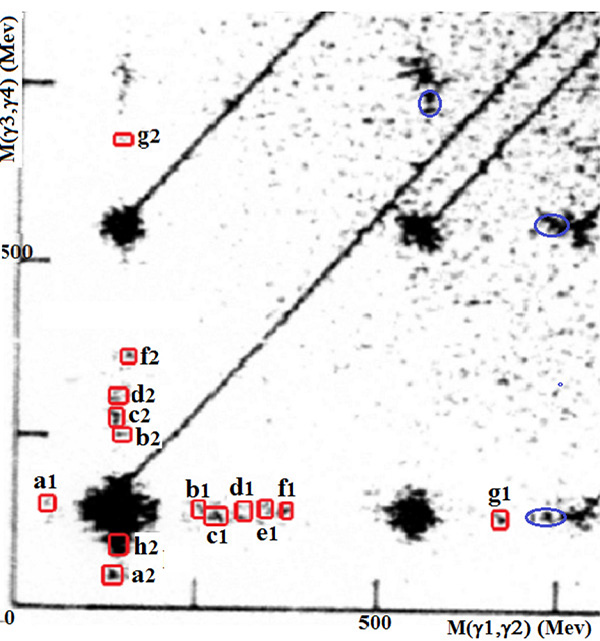 |
Fig. (1). (Color on line). Scanned insert from Fig. (6) of [5] showing the scatter plot of the two photon invariant mass M(γ3γ4) (in MeV), versus the two photon invariant mass M(γ1γ2) (in MeV). The areas surrounded by red squares correspond to the narrow weakly excited low mass unflavored mesons highlighted in this work. The three blue circled areas correspond to M(γγ) ≈ 743 MeV (see text). Reprinted figure with permission from Claude Amsler, Reviews of Modern Physics, Vol. 70, 1293 (1998). |
It is clear that several signals by themselves are rather small, hardly filling the 5 ! criterium. Their justification lies in the existence of several such observations at the same (or nearby) masses. The number of standard deviations (S.D.), in units of! , is:
where ∆ N corresponds to the total uncertainty, that we estimate in the following way. The error on the signal is propagated from the error on the total number of counts and the background. To the background it is attributed the same uncertainty as on the total, making a pessimistic estimation of S.D.
2.1. The Annihilation at Rest
The annihilation at rest into 4γ's was studied at LEAR (CERN) using the Crystal Barrel [5]. Fig. (6) of [5] shows the scatter plot of 2 γ invariant mass versus 2 γ invariant mass: M(γ3γ4)= f(M(γ1γ2)). The original figure has been scanned. The insert is selected to eliminate the most populated areas, not useful for the present purpose. The most intense concentration of data appears in spots corresponding to π0π0, π0η, π0ω, ηη, and ηω coincidences. The events delimited by circles (blue on line) will be discussed in a forthcoming paper [6]. The masses of the events delimited by squares (red on line) are reported in Table 1. They give the hint of the presence of narrow exotic low mass unflavored mesonic structures. Due to the low number of events, we do not claim that this plot constitutes an evidence of the existence of these resonances. However, the very good agreement between masses corresponding to name (1) and (2), (see Table 1), and the fact that such accumulation of events appears at same masses, in totally different experiments, with different probes, corroborate previous findings and reinforce previous statements. The agreement between these pieces of experimental information allows to strengthen the proof of their existence.
Comparison of narrow unflavored meson masses (in MeV) observed in the M(γ3 , γ4 ) = f(M(γ1 ,γ2) scatter plot from LEAR (CERN) [5]. AO means "already observed" from different reactions (see Table 2). All masses are in [MeV].
| AO | Name(1) | Mass(1) | Name(2) | Mass(2) |
|---|---|---|---|---|
| a1 | 45 | a2 | 45.7 | |
| 80 | h2 | 85 | ||
| 255 | b1 | 252.5 | b2 | 248.5 |
| c1 | 275 | c2 | 274.7 | |
| 310 | d1 | 310 | d2 | 309.6 |
| 348 | e1 | 345 | ||
| f1 | 375 | f2 | 365 | |
| 678 | g1 | 670 | g2 | 674 |
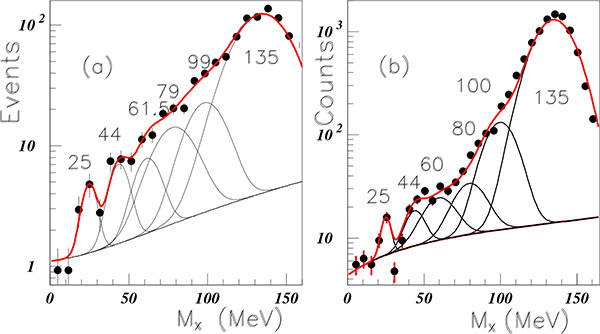 |
Fig. (6). (Color on line). Missing mass spectra. pp → ppX measured at CELSIUS [16] in insert (a); pd → 3HeX measured at COSY [17] in insert (b). |
The data corresponding to these structures appear in coincidence with a π0. The explanation may be related to the fact that, since the other PDG mesons are less excited than the π0, the correspondence with narrow structures is less probable and, hence, it is not observable in the data.
The masses extracted from Fig. (1) are identified by the corresponding code number in the plot. Some masses are rather imprecise due to poor counting. Table 1 shows these masses, compared with the masses extracted from other data. These last are shown in column "already observed" (AO). The following notation is used: "a", "b", ... identifying these blobs with increasing masses. They are called "1" when observed in M(γ3,γ4) = M(π0), and "2" when observed in M(γ1,γ2) = M(π0). This notation corresponds to an attempt to attribute the same rank to nearby masses. The good agreement observed for six (over eight) masses, supports the interpretation that the light structures correspond to real events and not to background. The lack of the e2 blob is associated to the progressive reduction of M(γ3,γ4) events for increasing mass. No h1 structure can be extracted from a symmetric large blob corresponding to the projection of π0π0 coincidences. The h2 mass is imprecise since located close to a more intense π0π0 blob.
2.2. The Annihilation in Flight
Other measurements [7] have been performed at LEAR (CERN), with the Crystal Barrel detector. The annihilation has been studied at different proton momenta. Fig. (2a) of Ref. [7] shows the invariant mass spectra of π0γ , obtained using 1940 MeV/c incident proton momenta, and plotted with 10 MeV bins. The figure shows a nice ω peak and a 0f2 bump, both discussed in the paper. It shows also a small peak in the 600 MeV region, which was not commented. These data, useful for the present discussion, are read out and plotted every 17.7 MeV in Fig. (2).
The peak is extracted at M = 587 MeV (S.D. = 7.1), which is very close to M = 588 MeV, where a narrow peak was observed in the SPES3 data [8].
 |
Fig. (2). (Color on line). Part of the invariant π0γ spectra, from annihilation at Pp = 1940 MeV/c measured at LEAR [7]. |
2.3. The Two Photon Invariant Mass Measured at the AGS
A revised analysis of the η→π0γγ reaction has been presented in [9]. The data correspond to the π-p→π0γγ reaction, studied at the AGS with a 716 MeV/c π- beam and the Crystal Ball detector. Different background contributions were suppressed by application of various cuts, with the help of Monte-Carlo simulations [9]. The validity of these corrections applied to the analysis, is tested in the Fig. (5c) of Ref. [9]. This figure shows a good agreement between the m2(γγ) spectra obtained by assuming the intermediate states: π-p →η n→π0γγ n →4γn and the π-p → π0γγ n → 4γn . These last data are read and shown in Fig. (3).
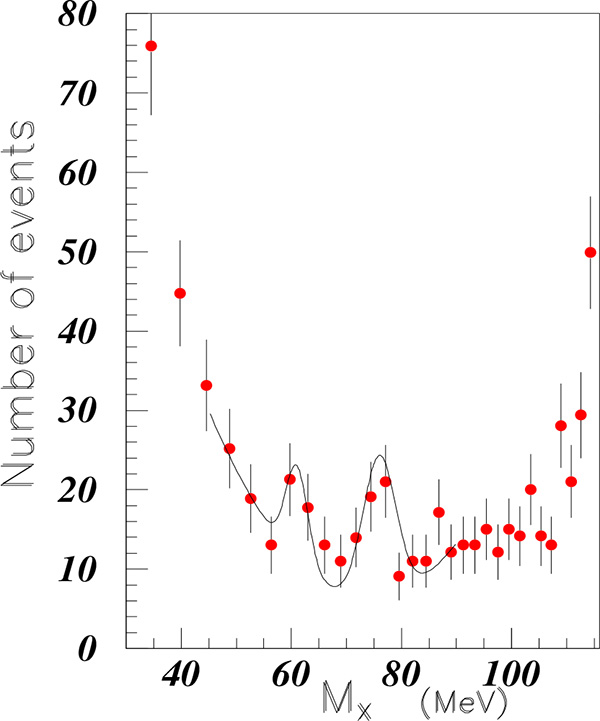 |
Fig. (5). (Color on line). Missing mass of the pp → ppX reaction measured at Uppsala [13]. |
 |
Fig. (3). (Color on line). M(γγ) spectra measured at AGS with using 716 MeV/c π- beam and Crystal Ball detector [9]. |
The authors applied several selection cuts, which limited their acceptance to be about 15% with a hole at the π0-meson mass. Fig. (3) exhibits a clear peak at M = 84 MeV, and a broad distribution beyond the pion mass. It is likely that the M=84 MeV and 200 MeV peaks are artifacts of the suppressed pion peak, and therefore they will not be considered further on. Since the background is not subtracted, the peak extractions are not very precise. However, the broad region exhibits two small peaks, making easier to attribute a mass to the structures, with a reasonable accuracy. The fit shown in Fig. (3) is obtained with gaussian functions, centred at M = 255 MeV (S.D. = 4.0), 343 MeV (S.D. = 5.1), (and 395 MeV). This last peak falls outside the range of the figure, therefore has no physical meaning; it only helps to fit the tail of the spectra.
2.4. The Two Photon Invariant Mass Measured from Reactions Involving High Energy Heavy Ions
Fig. (4) shows several spectra of two photon invariant mass, observed in high energy heavy ion experiments. On the figures, the correspondence with masses extracted previously from other data is indicated (see Table 2). Several very narrow structures can be observed in addition to the π0 peak. Several gaussians are drawn on the figure to drive the eyes. They should not be considered as quantitative fits. They only illustrate the possibility of several structures, which should appear in statistically precise measurements, where a small binning can be done. Such data call for dedicated measurements.
 |
Fig. (4). (Color on line). Two photon invariant mass observed in reactions involving high energy heavy ions (see text). |
The insert (a) of Fig. (4) shows the two-photon invariant mass distribution in Pb-Pb events after subtraction of the combinatorial background [10]. An integration over two channels is performed. The spectra exhibit an oscillatory pattern. As a consequence of so large error bars, all masses except the π0 at 135 MeV are ignored.
Insert (b) of 4 shows the real minus mixed spectra of two photon invariant mass, measured with the Pb + Pb reaction by ALICE/PHOS [11]. Small structures are tentatively indicated at the same masses observed by previous experiments. These masses are: M = 25 MeV, 45 MeV, 181 MeV and 194 MeV. In addition a structure is observed at M ≈ 167 MeV.
Inserts (c) and (d) of Fig. (4) shows the two photon invariant mass spectra for 200 A GeV 32S + Au events [12], measured at the CERN SPS with the lead glass spectrometer SAPHIR. A small structure close to M = 81 MeV is observed in insert (c), in agreement with previous observations. The spectra shown in insert (d) exhibits an oscillatory behaviour, at the following masses: M = 170 MeV, not previously observed (except in insert (b) of the same figure) at masses close to M = 181 MeV and M = 215 MeV, previously observed, and two structures at M = 190 MeV and M = 199 MeV, in both sides of the previously observed structure at M = 194 MeV. The effect of a minimization procedure is to lower the background and widen the gaussians.
Several peaks are defined by only three points. This is the consequence of the vicinity of the masses and of the experimental resolution. The main feature of these data, namely the oscillatory behaviour of the two photon spectra at masses close to the pion mass, requires new dedicated precise data with improved resolution and statistics. This feature is tentatively associated with the presence of several structures.
2.5. The pp → ppX Reaction
The missing mass of the pp → ppX reaction was measured at Uppsala with help of the PROMICE - WASA facility, and 310 MeV beam energy [13]. Fig. (1) of Ref. [13] exhibits several structures in the mass region between the γ and π0 missing masses. These data have been read, converted into linear scale (the original scale is logarithmic) as function of the missing mass (the original data are plotted versus , and drawn in Fig. (5). Two structures are visible above a background and have been fitted with a two degrees polynomial. Their masses are: M = 61 MeV (S.D. = 1.6) and 76 MeV (S.D. = 1.9), close to M = 62 MeV and 80 MeV, (already observed in [14, 15]).
2.6. The M = 25 MeV Narrow Meson Mass
Several figures have been plotted in [14], which focused on possible narrow structures in data from Celsius, Cosy, and JLAB CLAS Collaboration. This analysis ignored a possible structure at a mass close to M = 25 MeV. The present study focuses more precisely on this mass range. Fig. (6) shows the corresponding results. The fits are performed with help of all narrow structure masses. Although the present reanalysis intends to better extract the different peaks, this aim is not achieved except for the first one, which is the structure clearly extracted at M = 25 MeV in both inserts. Insert (a) shows the missing mass of the pp → ppX reaction measured at CELSIUS [16]. Insert (b) shows the missing mass of the pd → 3 HeX reaction measured at COSY [17].
2.7. The e+ e- → π+π- Reaction
The e+ e- → π+π- reaction has two distinctive features: - very small structures are expected, since two hadrons have to be produced from an electromagnetic interaction, - precise data with small binning are expected, since recent data have been collected at present colliders. Such data are presented in Fig. (7) measured at electron-positron BaBar collider [18]. Fig. (7) shows the cross-section of the e+ e- → π+π- reaction. From M = 305 MeV to M = 495 MeV, the data are plotted with a 10 MeV binning, and reported in Fig. (7a). Structures at 360 MeV (S.D. = 3.1), 410 MeV (S.D. = 4.7), and 475 MeV (S.D. = 1.4) are extracted with a common width, σ = 15 MeV. The data at other inserts are given with a 4 MeV binning. Structures at M = 546 MeV (S.D. = 2.6) (insert (b)), 635 MeV (S.D. = 4.2) (insert (c)), and 752 MeV (S.D. = 3.4) (insert (d)) are observed. A large background in insert (d) is fitted with a gaussian with the width of the ρ meson, but smaller mass (758 MeV instead of 775 MeV). A small peak at M = 775 MeV may correspond to the ω meson at a slightly smaller mass again (775 MeV instead of 782.7 MeV).
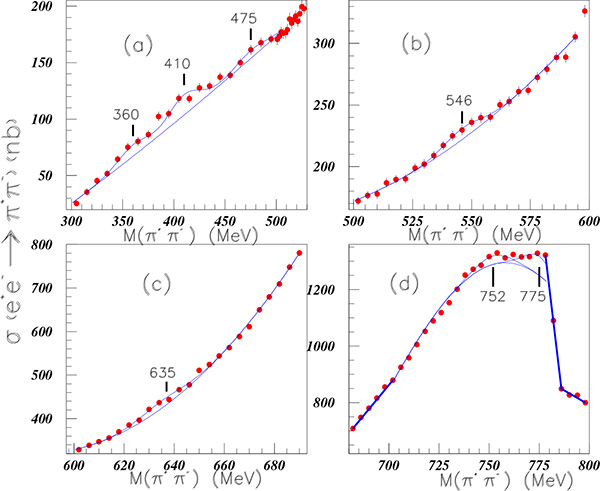 |
Fig. (7). (Color on line). Cross section of the e+e- → π+π- reaction measured at BaBar [18]. |
3. DATA ALREADY IDENTIFIED AS NARROW UNFLAVORED MESONS
3.1. The pp → ppX0 Reaction
The missing mass of the pp → ppX0 reaction has been studied using the SPES3 beam line of the Saturne synchrotron [8]. The cross sections were measured at three incident proton energies: Tp = 1520, 1805, and 2100 MeV, and several spectrometer angles at each energy. The experiment has been described in detail in several papers, depending of the mass range:
62≤ M ≤ 235 MeV in [14], 510≤ M ≤ 550 MeV in [19], and 550≤ M ≤ 759 MeV in [8].
Such description is omitted here. Several narrow structures have been extracted from the study of several spectra at different angles and different incident energies. The observed narrow structure mean masses are: M = 62, 80, 100, 181, 198, 215, and 228 MeV [14], where the mean masses are consistent with the SPES3 and some other experiments. In a higher mass range, the corresponding structure are at masses: 310, 350, 426, 470, 555, 588, 647, 681, 700, and 750 MeV [8, 19].
3.2. The np → npπ+π- Reaction
The invariant π+π- mass of the np → npπ+π- reaction, was studied at Dubna, using a detection based on bubble chambers. Several papers were published (with a small mass variation following the increase of statistics). The most recent paper [20] using the neutron Pn = 5 GeV/c incident beam momentum allows to observe narrow structures at the following masses: M = 350±3 MeV, 408±3 MeV, 489±3 MeV, 579±5 MeV, 676±7 MeV, 762±11 MeV, 878±7 MeV, 1036±13 MeV, and 1170±11 MeV. These structures are given with a number of standard deviations S.D. ≥3.0. A selection has been done on the proton angle: cos( θ*p ≥ 0).
3.3. Resonance in Mγγ in dC Interaction
The reaction d + C → γ + γ +x has been studied with the internal beam of the JINR Nuclotron [21] at momentum 2.75 GeV/c per nucleon.
The data are read and reported in Fig. (8). A resonance-like enhancement was observed at Mγγ = 360 ± 7 MeV (S.D. = 4.7). This structure was not observed in the Mγγ spectrum from pC interactions. The second peak corresponds to the η .
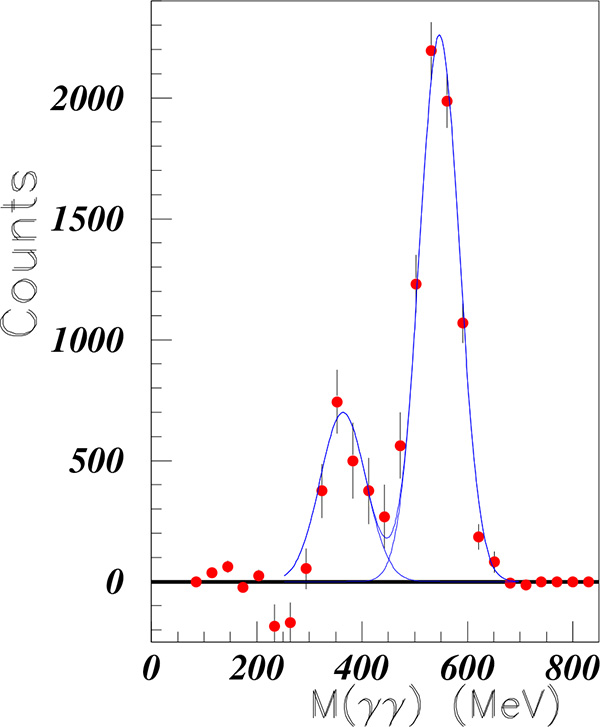 |
Fig. (8). (Color on line). Invariant Mγγ mass observed from the dC interaction measured at the JINR Nuclotron [21]. |
3.4. Recall of Other Data
Several sets of data have been scrutinized in Ref. [14] in order to extract small structures not discussed by the authors who analysed their data with different aims. Such narrow structures were observed below as well as above the pion mass. These data are from CELSIUS, COSY, MAMI, JLAB (halls A, B, and C). The corresponding discussion, detailed in [14], is briefly recalled here.
Table 2 shows consistency with the narrow exotic low mass mesons, extracted from different experiments and summarized in previous works. An additional mass M = 360 MeV found at the Nuclotron is not shown. The two masses at M = 227 MeV and 235 MeV from SPES3 are replaced by a common one at 231 MeV. The structures in Fig. (4) showing the two photon invariant masses observed in heavy ion reactions, are also omitted from Table 2 although most of the masses in insert (c) and (d) agree with narrow masses observed in different reactions. Some masses have been observed in three different sets of reactions or more; this increases their credibility.
Comparison of narrow unflavored meson masses (in MeV) observed in different experiments (see text).The second line indicates the references. Up., CE., CO., Ba., Sp3. and Du. stands respectively for Uppsala, CELSIUS, COSY, Babar, SPES3. and Dubna.
| LEAR | AGS | Up. | CE. | CO. | Ba. | Sp3 | Du. | PDG | ||
|---|---|---|---|---|---|---|---|---|---|---|
| [5] | [5] | [7] | [9] | [13] | [16] | [17] | [18] | [8] | [20] | [1] |
| 25 | 25 | |||||||||
| 45 | 45.7 | |||||||||
| 61 | 62 | |||||||||
| 85 | 84 | 76 | 80 | |||||||
| 100 | ||||||||||
| 137 | ||||||||||
| 181 | ||||||||||
| 190 | 198 | |||||||||
| 215 | ||||||||||
| 231 | ||||||||||
| 252.5 | 248.5 | 255 | ||||||||
| 275 | 274.7 | |||||||||
| 310 | 309.6 | 310 | ||||||||
| 345 | 343 | 350 | 350 | |||||||
| 375 | 365 | 360 | ||||||||
| 410 | 427 | 408 | ||||||||
| 475 | 489 | |||||||||
| 546 | 555 | 547.9 | ||||||||
| 587 | 588 | 579 | ||||||||
| 635 | 647 | |||||||||
| 670 | 674 | 681 | 676 | |||||||
| 700 | ||||||||||
| 752 | 750 | 762 | ||||||||
| 782.7 |
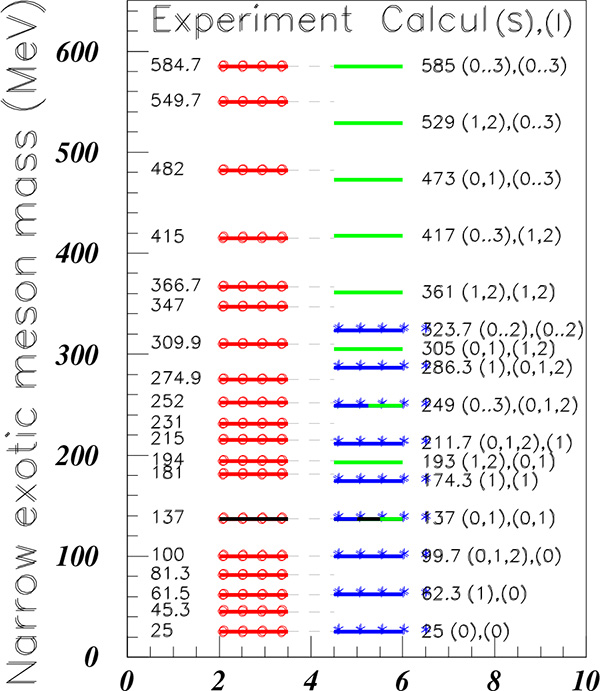
The masses shown in Table2, are presented with the attempt to attribute the same rank to nearby masses from different experiments. Then we observe that the structures, extracted from different reactions, are often observed at nearby masses. The mean values of these masses are: M = 25, 45.3, 61.5, 81.3, 100, 181, 194, 215, 231, 252, 274.9, 309.9, 347, 366.7, 415, 482, 549.7, 584.7, 641, 675.2, 700, and 754.7 MeV, as reported in the first column of Fig. (9).
4. DISCUSSION
4.1. Attempt for an Interpretation Using a Phenomenological Model Based on Two Quark Cluster Configurations
As already mentioned, there is no room for these mesonic structure masses to a description within the classical quark model. An attempt is therefore presented below to associate the masses of the mesonic structures with masses computed within a simple mass relation based on two quark clusters.
A mass formula was derived some years ago for two clusters of quarks at the ends of a stretched bag in terms of color magnetic interactions [22]. A tentative description of exotic low mass structures in mesonic, baryonic, and dibaryonic spectra, using this mass formula, has been previously proposed. The mesonic structure masses were described, using , or clusters up to M = 620 MeV, and between M = 620 MeV and M = 750 MeV [8]. The narrow baryonic structure masses were described either by or clusters [23]. Finally the dibaryonic structure masses were described [24] using the following two clusters: . The following equation was used:
where M0 and M1 are parameters deduced from experimental mass spectra and i1(i2) , s1(s2) are the isospin and spin of the first (second) quark cluster. The same approach is employed here. Eq. (1) involves a large degeneracy. We made the assumption that the simplest configuration is preferred, otherwise the possible spin and isospin will increase and the parity will be degenerate since additional configurations will always be possible.
Eq. (1) is applied to two quark clusters . The simplest choice corresponds to the most strongly excited meson, i.e., to the pion. Since therefore s1 = s2 = i1 = i2 = 1/2 , the previous equation becomes M = M0 + 2M1 = 137 MeV. The next cluster configuration is . The corresponding minimum mass is obtained with s1 = s2 = i1 = i2 = 0 . Corresponding to these values, M = M0. We associate this mass to our minimum narrow meson mass, therefore M0 = 25 MeV, from which one concludes that M1 = 56 MeV.
Experimental exotic narrow meson masses are shown in Fig. (9) with red lines overcomed by empty circles. The masses are calculated with these M0 and M1 values, and are shown in Fig. (9). The assumption for the quark clusters corresponds to masses drawn with blue lines and blue stars. The same masses are obtained within the assumption of quark clusters. The assumption for quark clusters, corresponds to masses drawn on line in green.
The figure is limited to M = 600 MeV, since with the M0 and M1 parameter values, s1 = s2 = i1 = i2 = 3/2 corresponds to M = 585 MeV.
Larger masses can be obtained with introduction of heavier quark clusters. It is noteworthy that the assumption quark clusters, allows to find several experimental masses. Table 3 shows these masses, limited to a value M≤780 MeV.
Some calculated masses within the quark clusters, compared to the experimental values.
| S1 | S2 | i1 | i2 | M(MeV) | Exp.(MeV) |
|---|---|---|---|---|---|
| 3/2 | 3/2 | 3/2 | 3/2 | 585 | 584.7 |
| 1/2 | 1/2 | 1/2 | 5/2 | 585 | 584.7 |
| 3/2 | 1/2 | 1/2 | 5/2 | 641 | 641 |
| 5/2 | 3/2 | 3/2 | 3/2 | 678.3 | 675.2 |
| 3/2 | 3/2 | 1/2 | 5/2 | 697 | 700 |
| 1/2 | 1/2 | 3/2 | 5/2 | 753 | 754.7 |
| - | - | - | - | - | - |
| 1/2 | 1/2 | 3/2 | 5/2 | 613 | |
| 5/2 | 1/2 | 1/2 | 5/2 | 734.3 |
The first line of Table 3 shows the largest mass obtained within the quark cluster assumption. Starting from the second line, we calculated the successive increasing masses, which fit well the experimental masses, again without any new adjustable parameter. The bottom of Table 3 shows two calculated masses not observed experimentally.
The predicted possible spins and isospins are obtained from spins and isospins of both clusters. The predicted parities for exotic mesons depend on the number of . The negative parity of the π is obtained with or . The choice necessitates an orbital excitation between both clusters to get the negative parity.
The agreement between data and predictions in Fig. (9) is noteworthy up to M = 260 MeV, and above 350 MeV. Two masses at M = 45.3 and 81.3 MeV have no predicted counterparts. A mass, predicted at M = 323.7 MeV is not observed. The pion mass and the structure at M = 252 MeV calculated at M = 249 MeV, are obtained at the same time with and configurations.
Such description is strengthen by the observation that the gap between two adjacent exotic meson masses are rather constant and equal to δ M ≈ 18.7 MeV. A comparable situation was already observed in the studies of narrow exotic baryonic and dibaryonic masses. For example in the dibaryon field, between M = 2194 MeV, and 2016 MeV, five narrow masses were observed regularly separated by about 35 MeV. As already reminded [15], "the model [25], proposed some time ago, associates the narrow structure masses below the π threshold production, to the multiproduction of a genuine virtual Goldstone boson with a mass close to 20 MeV." This model can explain the level spacing of narrow mesonic structures experimentally observed.
It has been already mentioned that the usual calculations associate the multiquark clusters to masses larger than M = 1.5 GeV. The success of the present mass formula, based on quark clusters, which is able to reproduce many masses within a simple equation and only two parameters, justifies to consider the possibility of new physics on the basis of additional low mass hadrons. which would interact less strongly than the "classical" ones.
4.2. Comparison Between Successive Exotic Narrow Meson Masses
We attribute a rank as an integer sequence of the resonances, according to their increasing masses. The rank numbers the successive increasing exotic mesonic structure masses. It is the main parameter used for all studies inside fractal properties. The masses of the several narrow structures, given in Table 2, are plotted versus their rank in Fig. (10) which magnifies the low mass range. Fig. ( 11) shows all data. The SPES3 data [14, 8] are shown with solid red circles; the Dubna data [20] with empty purple crosses; the Lear data of at rest [5] empty blue squares, the Lear data of in flight [7] by blue star, the Uppsala data [13] with solid green triangles. The PDG masses [1] are also introduced, and are represented by black stars. The narrow structure masses observed in the AGS experiment [9], the Babar measurement [18], or the high energy heavy ion experiments [10-12] are omitted from the figure. Their masses agree with those considered in the figure, as seen in Table 2.
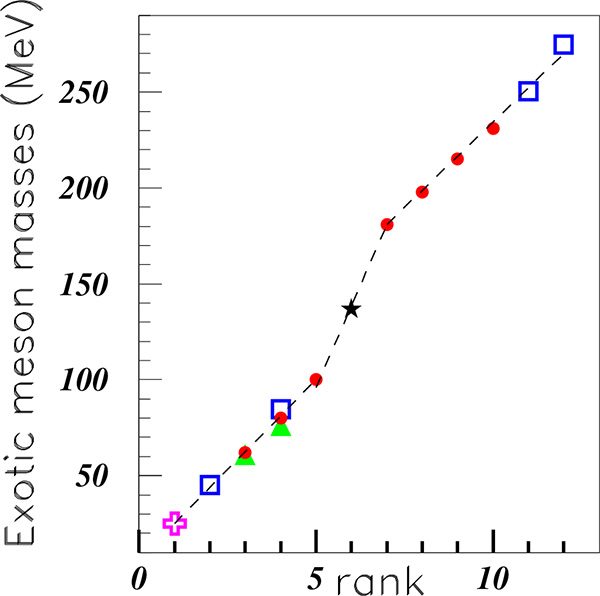 |
Fig. (10). (Color on line). Exotic low mass meson masses. SPES3 data [14, 8]: solid red circles; Lear data [2]: empty blue squares; Uppsala data [5]: solid green triangles. The Celsius [16] and the Cosy narrow structure mass [17] are shown by a purple empty cross. The PDG π0 mass [1] is introduced by a black star. |
 |
Fig. (11). (Color on line). Exotic meson masses. The SPES3 data [14, 8] are shown with solid red circles; the Dubna data [20] with empty purple crosses; the Lear data with at rest [5] empty blue squares, the Lear data with in movement [7] by blue star, the Uppsala data [13] with solid green triangles. The PDG masses [1] are also introduced, and are represented by black stars. See text. |
We observe a "regular" mass variation, with the same slope for the first and third straight line segments. Such behaviour suggests log-periodic fluctuations and fractal properties with not linear scale laws [26, 27].
We show therefore in Fig. (12) the log of the masses versus the log of the rank. We have a discrete scale invariance, since we observe linearities between the logs, for several values of the fundamental scaling ratios. Such property was already observed for a smaller statistics [28].
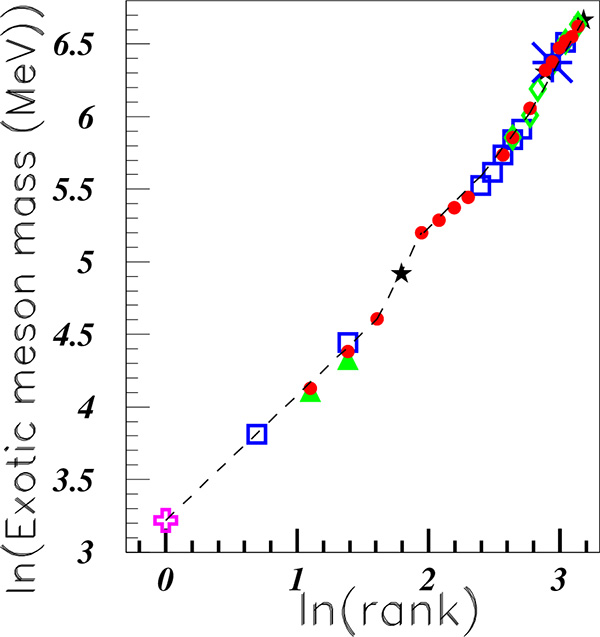 |
Fig. (12). (Color on line). Log of the exotic meson masses versus the log of the rank. The SPES3 data [8-10] are shown with solid red circles; the Dubna data [20] with empty purple crosses; the Lear data with at rest [5] empty blue squares, the Lear data with in movement [7] by blue star, the Uppsala data [13] with solid green triangles. The PDG masses [1] are also introduced, and are represented by black stars. |
CONCLUSION
In conclusion, we summarize our paper by a result and an assumption.
The present work collects the observation of small peaks in the spectra obtained in different experiments. Some of the peak highlighted in the present work have S.D.≥4 . Previously published observations report on S.D.≥5 for similar masses. The statement that they are genuine physical structures is supported by their presence in several sets of totally different data.
Although the cross sections associated to the narrow unflavored mesonic structures are small, they have been observed in several experiments with reasonable statistics. The agreement between the observations from different reactions increases the confidence on their genuine existence. The mean values of the observed masses are:
M = 25 MeV, 45.3 MeV, 61.5 MeV, 81.3 MeV, 100 MeV, 181 MeV, 194 MeV, 215 MeV, 231 MeV, 252 MeV, 274.9 MeV, 309.9 MeV, 347 MeV, 366.7 MeV, 415 MeV, 482 MeV, 549.7 MeV, 584.7 MeV, 641 MeV, 675.2 MeV, 700 MeV, and 754.7 MeV.
The weakness of their excitation, prevents generally (up to now) to attribute quantum numbers from angular distribution studies. Such information will be very useful to confirm or infirm the possibility to explain these weakly excited narrow mesons with mesons having quantum numbers excluded by the non relativistic quark model.
The determination of the nature of these resonances, remains still to be clarified. It is an important challenge. These resonances were sometimes associated to dibaryon production in intermediate states, but at least some of them, observed in or e+e- reactions, cannot be produced by such process. A quasimolecular state of two pions can be associated only to the structure at M ≈ 270-275 MeV. The lattice calculations predict that glueballs lie at masses larger than 1.5 GeV. In the same way, tetraquarks are theoretically predicted to lie at masses larger than 1.5 GeV.
The assumption presented above, assumes that the tetraquark description remains the most likely. An attempt is tentatively suggested to reproduce the narrow structure masses, with use of a mass formula based on of and quark clusters. Most of the experimental masses can be reproduced. Such approach is consistent with the existence of low mass hadrons as predicted in [25], never considered up to now.
The success of such mass formula, based on quark clusters which is able to reproduce many masses with a very simple equation and only two parameters, suggests the possibility of new physics, where low mass hadrons are present. These results deserve theoretical studies.
CONFLICT OF INTEREST
The authors confirm that this article content has no conflict of interest.
ACKNOWLEDGEMENTS
Thanks are due to C. Amsler for interest in our work and to S. Pacetti, who provided us with data from BaBar in tabulated form.
REFERENCES
| [1] | Beringer J, Arguin J-F, Barnett RM, et al. (Particle Data Group) Review of Particle Physics Phys Rev D 2012; 86: 010001-1525. |
| [2] | Amsler C. NON-q anti-q MESONS [Available from http://pdg.ihep.su/2007/reviews/nonqqbar_mxxx050.pdf ] |
| [3] | (a) Barnes T. Exotic Mesons, Theory and Experiment Acta Phy Polon B31 2000; 2545-56. hep-ph/0007296.; (b.) Amsler C, Tornqvist NA. Mesons beyond the naive quark model Phys Rep 2004; 398: 61-117. |
| [4] | Godfrey S, Olsen L. The exotic XYZ charmonium-like mesons Annu Rev Nucl Part Sci 2008; 58: 51-73. |
| [5] | Amsler C. Proton-antiproton annihilation and meson spectroscopy with the crystal barrel Rev Mod Phys 1998; 70: 1293-339. |
| [6] | Tatischeff B, Tomasi-Gustafsson E. in preparation |
| [7] | Abele A, Adomeit B, Amsler C, et al. pp-annihilation into ωπ0, ωη, ωη' Eur Phys J C 2000; 12: 429-39. |
| [8] | Tatischeff B, Yonnet J, Rekalo MP et al, et al. Light mesons: π , η and ω and exotic low mass meson production at intermediate energies in nucleon-nucleon scattering Phy Rev C 2000; 62: 054001-11. |
| [9] | Prakhov S, Nefkens BMK, Allgower CE, et al. Measurement of the invariant-mass spectrum for the two photons from the η→π0γγ decay Phys Rev C 2008; 78: 0152061-10. |
| [10] | Alice: Physics Performance Report, Volume, II Phys G: Nucl Part Phys 2006; 32: 12951-747. |
| [11] | Ippolitov M, Vasil'ev A. CALOR2004, www.pg.infn.it/calor-2004/program/.../ippolitov.pdf |
| [12] | Berger F, Bock D, Clewing G, et al. Particle identification in modular electromagnetic calorimeters Nucl Instrum Meth A 1992; 321: 152-64. |
| [13] | Johansson A, Wilkin C. Hard bremsstrahlung in the pp → ppγ reaction Phys Lett B 2009; 673: 5-8. |
| [14] | Tatischeff B, Tomasi-Gustafsson E. Search for low-mass exotic mesonic structures I : Experimental Results Phys Elem Part Lett 2008; 5: 363-70. |
| [15] | Tatischeff B, Tomasi-Gustafsson E. Search for low-mass exotic mesonic structures II Attemps to understand the results Phys Elem Part Lett 2008; 5: 420-21. |
| [16] | Bilger R, Brodowski W, Calen H, et al. Two pion production in proton-proton collisions near threshold at CELSIUS Acta Phys Pol B 1998; 29: 2987-91. |
| [17] | Betigeri M, Bojowalda J, Budzanowskid A, et al. Simultaneous measurements of the p + d → (A=3)+ π reactions Nucl Phys A 2001; 690: 473-93. |
| [18] | BABAR Collaboration Precise Measurement of the e+e- → π+π - (γ) cross section with the initial state radiation method at Phys Rev Lett 2009; 103: 231801-7. |
| [19] | Yonnet J, Tatischeff B, Boivin M, et al. ABC resonance in the p p → pp X0 reaction, or is the ABC effect made of colored quark cluster configurations ? Phys Rev C 2001; 63: 014001-11. |
| [20] | Troyan YA, Beljaev AV, Troyan AY, et al. Search and study of low-mass scalar mesons in the reaction np → np π+π- at the impulse of neutron beam Pn = (5.20 ± 0.12) GeV/c^2 Phys Part Nuclei Lett 2012; 9: 77-87. (in russian) |
| [21] | Abraamyan KU, Sissakian AN, Sorin AS, et al. Resonance structure in the invariant mass spectrum in pC and dC interactions Phys Rev C 2009; 80: 034001-18. |
| [22] | (a) Mulders PJ, Aerts AT, de Swart JJ. Multiquark states III Q6 dibaryon resonances Phys Rev D 1980; 21: 2653-71.; (b.) Mulders PJ, Aerts AT, de Swart JJ. Multiquark states : Q3 baryon resonances Phys Rev D 1979; 19: 2635-52.; (c.) Mulders PJ, Aerts AT, de Swart JJ. Negative-parity nn resonances and extraneous states Phys Rev Lett 1978; 40: 1543-6. |
| [23] | Tatischeff B, Yonnet J, Comets MP, et al. Experimental evidence for narrow baryons in the mass range 1.0 ≤ M ≤ 1.46 GeV Eur Phys J A 2003; 17: 245-67. |
| [24] | Tatischeff B, Yonnet J, Boivin M, et al. Evidence for narrow dibaryons at 2050, 2122, and 2150 MeV observed in inelastic pp scattering Phy Rev C 1999; 59: 1878-89. |
| [25] | Walcher T. A simple model to explain narrow nucleon resonances below the π threshold arxivhep-ph/0111279 |
| [26] | Sornette D. Discrete-scale invariance and complex dimensions Phy Rep 1998; 297: 239-70. |
| [27] | Chaline J, Nottale L, et Grou P. Des fleurs pour Schrodinger. La relativité d'échelle et ses applications Ellipses edition 2009; 368: 1-423. |
| [28] | Tatischeff B. What do fractals learn us concerning the masses of fundamental particles, of hadrons, and of nuclei ? Concerning also disintegration life-times ? Pos(Baldin ISHEPP XXI) 2013; 055: 1-36. |


